About the plugin:
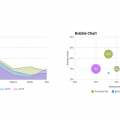
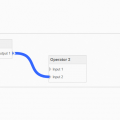
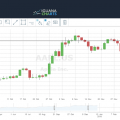
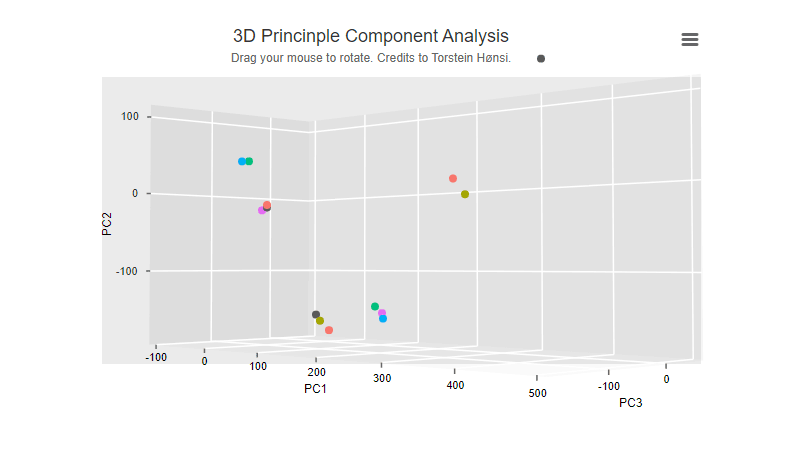
This is a nice and cool chart editor for interactive visualisation, based on jQuery and HighCharts. Chart types include dot/scatter, 2D scatter, line, bar/column, pie, and heat map. It’s powerful when analysing large data sets.
Download Demo Github Page