About the plugin:
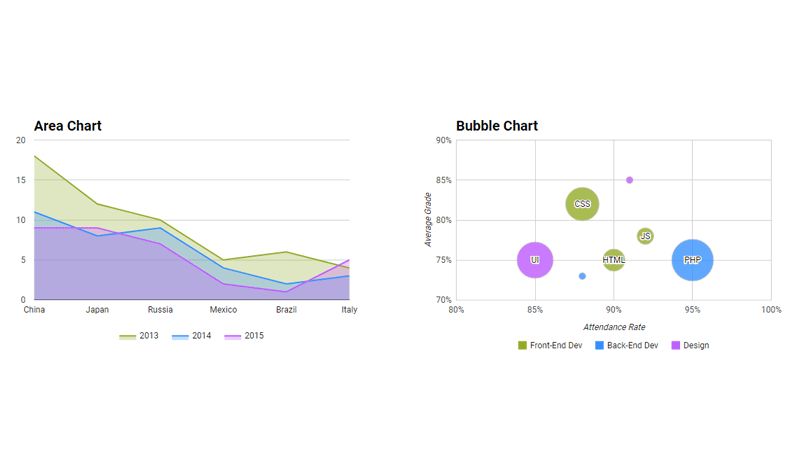
This is an amazing and wonderful jQuery plugin for transforming HTML tables into charts using Google Charts.
Features:
- Creation of all chart types using Google Charts – Visit https://developers.google.com/chart/interactive/docs/gallery
- Extraction of data from HTML tables, Google spreadsheets, and JavaScript arrays
- Accessible data – Using HTML tables as data sources makes data accessible to screen readers and searchbots
- Generation of HTML tables from other data sources – Makes data extracted from JS arrays and Google Sheets accessible
- Showing and hiding of HTML tables accessibly
- Manipulation of data extracted from HTML tables and Google Sheets using JavaScript arrays
- Transposition of data – swapping of rows and columns
- Resizing of charts on screen resize – Responsive Web Design
- Chart aspect ratio control
- Art direction – Zoom and offset of chart – Useful for refining the region displayed in geoCharts
- Customization of chart tooltips and annotations
- Customization of all Google Chart options – Fonts, colors, chart formatting, etc.
- Adding Google Chart event handlers – Event handlers can be defined in the options